Edition


-YandY-202303241229.gif)
-202403121604.gif)


-YandY-202303241230.gif)

Boats for sale
| Laurent Giles 'Jolly Boat' Exeter |
 |
| Laser XD 203301 Upminster |
 |
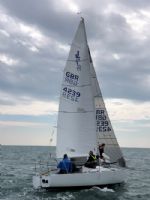
| J24 (Sail No. 4239) Dartmouth |
 |
List classes of boat for sale |


TruSail: training analytics |
Post Reply 
|
Page <123 |
| Author |
 Printable Version Printable Version Delicious Delicious Digg Digg Facebook Facebook Furl Furl Google Google MySpace MySpace Newsvine Newsvine reddit reddit StumbleUpon Translate StumbleUpon Translate Twitter Twitter Windows Live Windows Live Yahoo Bookmarks Yahoo Bookmarks Topic Search Topic Search  Topic Options Topic Options
|
MerlinMags 
Admin Group 
Joined: 19 Mar 04 Location: UK, Guildford Online Status: Offline Posts: 585 |
 Post Options Post Options
 Quote Reply Quote Reply
 Topic: TruSail: training analytics Topic: TruSail: training analyticsPosted: 23 Feb 19 at 9:39pm |
|
It is the bit that happens in Excel (or wherever) that interests me. You've got a few thousand numbers representing heel angle... but how do you take those and actually interpret them to say "you didn't hike hard enough" or "you're getting better at keeping it flat".
What about all the times the app records a heel angle of ten degrees, but it was because you were mid-tack? You need to excuse those ones! |
|
 |
|
|
Rupert
Really should get out more
Joined: 11 Aug 04 Location: Whitefriars sc Online Status: Offline Posts: 8956 |
Post Options
Quote Reply
Posted: 24 Feb 19 at 11:26am |
|
You'd have to link angle of heel to changes in direction, so a tack or big luff or bear away ( mark roundings, for instance) would be automatically excluded.
|
|
|
Firefly 2324, Puffin 229, Minisail 3446 Mirror 70686
|
|
|
|
|
Guests
Guest Group 
|
Post Options
Quote Reply
Posted: 24 Feb 19 at 4:58pm |
Depends what you want to see. If you want second by second playback, then just some smoothing would do fine. If you're looking descriptive statistics for the whole sail then you'd have to do some filtering. You could filter out heel during heading changes pretty easy. But if you sailed with 5 degrees leeward heel all the time it would average out, so the mean might look better. I guess you'd want to show average difference from upright, you might not then know if that was windward or leeward heel. How you'd filter downwind i'm not sure, because I'd guess your targets would be different for different points of sail. If you had AWA measured you could filter based on that to group data by point of sail perhaps?
|
|
|
|
|
MerlinMags
Admin Group
Joined: 19 Mar 04 Location: UK, Guildford Online Status: Offline Posts: 585 |
Post Options
Quote Reply
Posted: 25 Feb 19 at 3:27pm |
|
I think it is going to end up too difficult. In theory all the ideas seem fine, then when faced with real data the ability to say "the boat was between 3 and 8 degrees heeled during this reaching leg" ends up impossible.
|
|
|
|
|
Guests
Guest Group
|
Post Options
Quote Reply
Posted: 25 Feb 19 at 6:30pm |
|
You cant look at heel angle in isolation, out of context. So a single number answer wont work. It needs to be viewed over time, in relation with heading, speed and ideally wind strength.
Edited by Peaky - 25 Feb 19 at 6:31pm |
|
|
|
|
gonesailing
Newbie 
Joined: 21 Feb 19 Online Status: Offline Posts: 3 |
Post Options
Quote Reply
Posted: 26 Feb 19 at 7:04am |
|
It is not too hard to detect context during track analysis or in real time. I'm working on tacks (and jibes) analytics like now. Looks like it will be ready for testing soon.
|
|
|
|
|
Pewit
Groupie 

Joined: 25 Jan 14 Location: Sydney, Australia Online Status: Offline Posts: 70 |
Post Options
Quote Reply
Posted: 16 May 19 at 3:18pm |
|
I think the main issue is to have a readily understandable real-time display which gives you data you can take in quickly from the corner of your eye, given the number of other variables you need to be looking at.
I've experimented with iRegatta and RaceQs on both watch and mast-mounted mobile phone and found it too hard to be able to switch focus between the screen and telltales, boats, wind, waves etc. Post race analysis with video is useful (when augmented with the data) but real time feedback would be much more useful and accelerate the improvement process. |
|
|
|
|
Post Reply
|
Page <123 |
| Forum Jump | Forum Permissions You cannot post new topics in this forum You cannot reply to topics in this forum You cannot delete your posts in this forum You cannot edit your posts in this forum You cannot create polls in this forum You cannot vote in polls in this forum |
Bulletin Board Software by Web Wiz Forums® version 9.665y
Copyright ©2001-2010 Web Wiz
Change your personal settings, or read our privacy policy
Copyright ©2001-2010 Web Wiz
Change your personal settings, or read our privacy policy